CISFA uses Open Source Geographic Information Systems (e.g., QGIS) for meteorological, climatic, and environmental monitoring.
The G.I.S. (Geographical Information System) is a tool that allows for the analysis, representation, and querying of entities or events occurring within a specific territory. The technology embedded within these software programs integrates with common operations that can be performed on spatial databases, such as searches, geometric and mathematical processing, statistical analyses, and graphing. The specific functionalities of a G.I.S. include the georeferencing of territorial data, their processing, and above all, their representation in the form of cartograms or tables tailored to variously sized portions of the territory, achieved through their stylization and correlation within the cartography.
These capabilities distinguish geographic systems from any other information system, providing users with a tool that allows them to visualize and analyze information to explain events, as well as to plan or design territorial infrastructures.
For all problems involving a geographic component, G.I.S. enables the creation of maps, the integration of information, the visualization of scenarios (including in three dimensions), the resolution of complex mobility issues, and the development of the most effective solutions.
For instance, it is possible to locate any object on the ground, study the evolution of the agricultural landscape, or even track the courses of rivers over time. These are complex, if not impossible, operations to perform without such a tool.
In particular, these systems are used for:
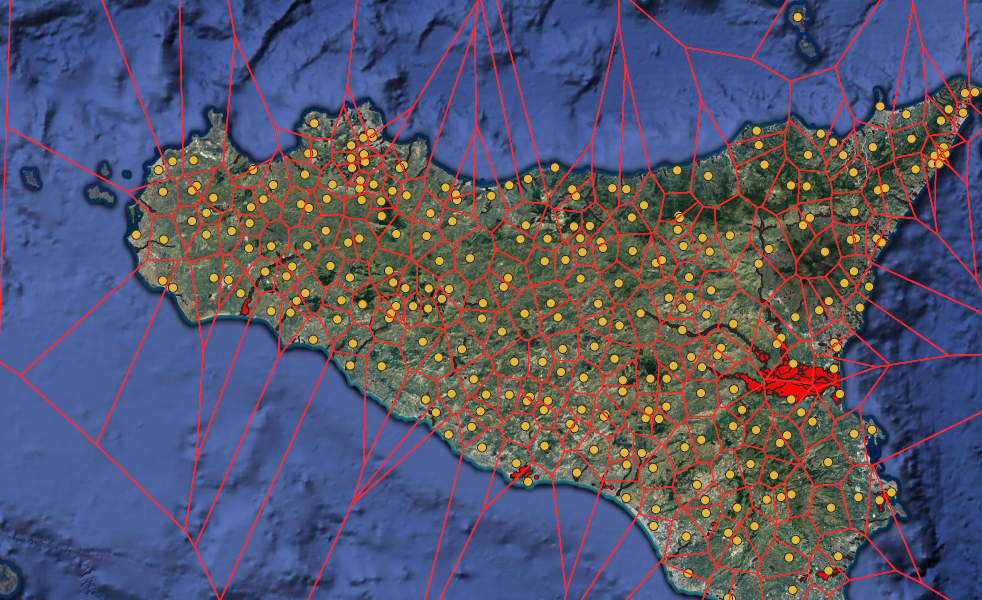
- Pluviometric analysis correlated by area to hydraulic risk zones. In the figure, an example of analysis developed from the data of the thermo-pluviometric stations present on the island is shown. This was carried out using a geometric analysis defined as “Thiessen polygons”, which depicts the area of influence of the respective stations. Polygons delimiting the hydraulic risk areas have been associated with these influence areas in order to deduce the possibility—based on average rainfall or peaks—of hydrological/hydraulic problems occurring in areas where rainfall is or has been most intense.
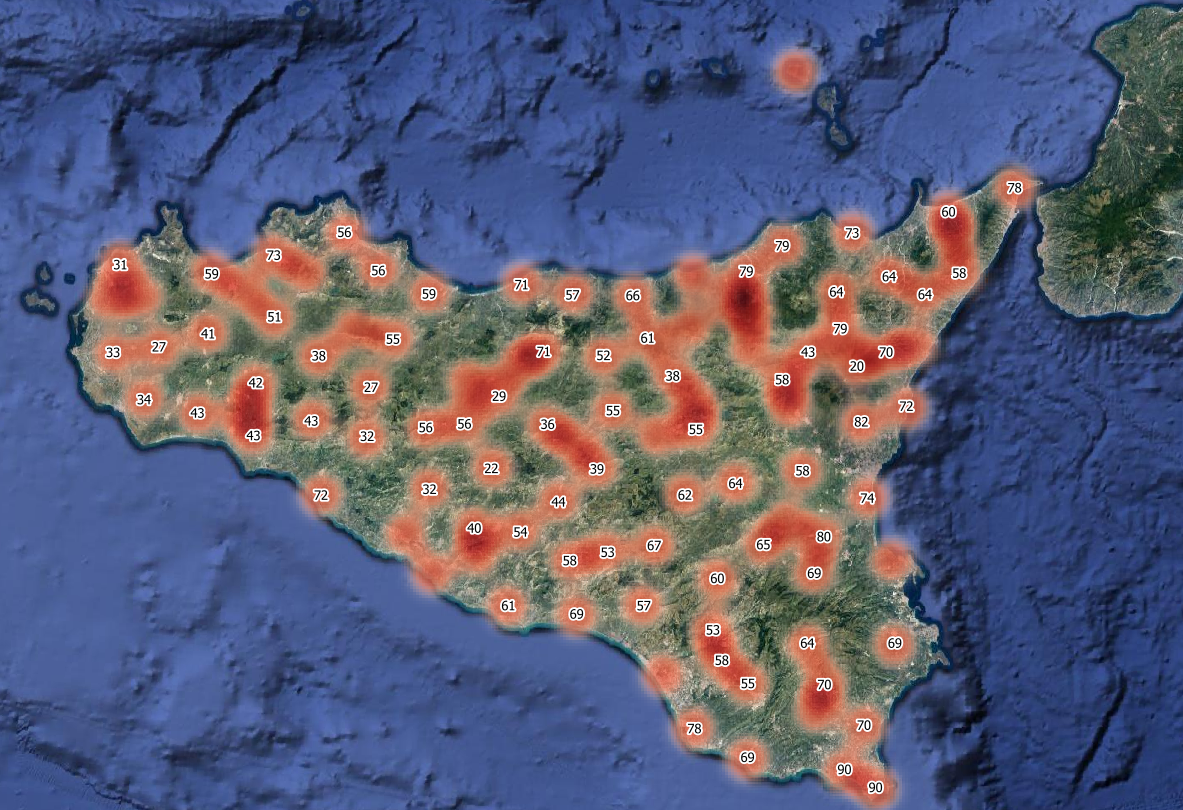
- Climatological analysis of the Mediterranean context. An example of processed data resulted in a Heat Map (or concentration map) based on the average relative humidity data recorded by individual stations within a time interval between 13:00 and 24:00. Humidity data are crucial because their evaluation over time makes it possible to characterize the climatic trend of the Mediterranean basin, indicating a shift toward either desertification or tropicalization.